• Skip to primary navigation
  • Skip to main content
  • Skip to footer
Bluetab

Bluetab

an IBM Company

  • SOLUTIONS
    • DATA STRATEGY
    • Data Readiness
    • Data Products AI
  • Assets
    • TRUEDAT
    • FASTCAPTURE
    • Spark Tune
  • About Us
  • Our Offices
    • Spain
    • Mexico
    • Peru
    • Colombia
  • talent
    • Spain
    • TALENT HUB BARCELONA
    • TALENT HUB BIZKAIA
    • TALENT HUB ALICANTE
    • TALENT HUB MALAGA
  • Blog
  • EN
    • ES

Blog

$ docker run 2021

February 2, 2021 by Bluetab

$ docker run 2021

David Quintanar Pérez

Consultor BI

I first came across Docker when I was at university, in my first Distributed Database class. It was something odd at first, something I could not imagine would exist, love of development at first sight.

Problems that arise when developing

When I thought about learning, experimenting or building software, I did it on my machine. I had to install everything I needed in it to start developing and I had to fight with the versions, dependencies, among others, and that takes time. Then I faced the challenge of sharing what I had created with friends, a team or a lecturer. Not to mention that they had to install everything too, and with the same specifications. The best option was to do it in a virtual machine from the start and to be able to share it with everything configured. Then finally you faced the fact of the size it occupied. Hoping by this time that it did not have to simulate a cluster. In the final battle are you, the application and the virtual machine(s) against the resources of the computer where it runs in the end. And even overcoming the problems we had already met, the dependencies, the OS and the hardware resources challenged us again.

Docker as a solution

On that day in class, I discovered the tool that lets you Build, Distribute and Run your code wherever, in an easy, open source manner.
This means that with Docker, at build time, you can specify the OS where it will run, the dependencies and versions of the applications it will occupy. Ensuring that it will always run in the environment it requires.

That when distributing what you built, to who needs it, you will be able to do it quickly, simply and without worrying about pre-installing, because everything will be defined from the time when you started building.

When you specify the environment you need, you can replicate it in development, production or on whatever computer you want without extra effort. Ensuring that as long as you have Docker, it will run properly

«Docker was created in 2013, but if you still don’t know it, 2021 will be the year you start using it. StackOverflow now has it rated second among the platforms that developers love most and in first place as the one they want most.»

What is Docker? And how does it work?

Containers

Let’s take a closer look at what Docker is and how it works. If you have already had an initial encounter with this tool, you will have read or heard about the containers.

Starting with the fact that containers are not unique to Docker. There are Linux containers, which allow applications to be packaged and isolated to enable them to run in different environments. Docker was developed from LXN, but has deviated from it over time.

Images

And Docker takes it to the next level, making it easy to create and design containers with the aid of images.

Images can be seen as templates that contain a set of instructions in order, which are used to create a container and how this needs to be done.

Docker Hub

Docker Hub is now the world’s largest library and community for container images, where you can find images, obtain them, share what you create and manage them. You just need to create an account. Do not hesitate to go and explore it when you finish reading.

Example

Now imagine you are developing a web application, you need an Apache HTTP service in its version 2.5 and a MongoDB service in its latest version.

You could set up a container for each service or application with the help of predefined images you got from Docker Hub and they can communicate with each other with the aid of Docker networks.

Using MongoDB, but with its stored database information coming from your preferred provider’s cloud service. This can be replicated in the development and production environment in the same way, quickly and easily.

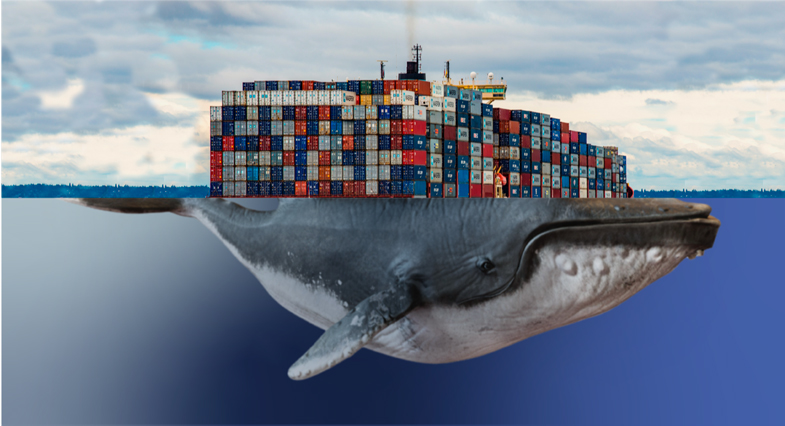
Containers versus Virtual Machines

One difference is that containers make the operating system virtual instead of hardware.

If we look at other aspects, as well as multiple virtual machines can run in a single one, containers can do the same, but containers take less time to start up.

And while each virtual machine includes a complete copy of an operating system, applications, etc., containers can share the same OS kernel, which can make them lighter. Container images are typically tens of MB in size, while virtual machines can take up tens of GB.

There are more things that I invite you to look out for, because this does not mean we stop using virtual machines or that Docker is better, just that we have another option.

Having containers running within virtual machines has become more complex and flexible

Download and install Docker

You can download and install Docker on multiple platforms (MAC, Windows and Linux) and you can consult the manual from the official website.

There are also several cloud service providers that let you use it.

Play with Docker

You also have the alternative of trying out Docker without installation with Play with Docker. As the name says, you can play with Docker by downloading images or repositories to run containers in Play with Docker instances. All at your fingertips with a Docker Hub account.

2021

Now you know more about the issues that exist in development, what Docker is and that it works as a solution, a little about its system of containers and images that you can create or get from Docker Hub. You understand some differences between Virtual Machines and Docker. That docker is multi-platform and you can experiment with it without installing it on your computer with Play with Docker.

Today more and more job offers are requesting Docker, including as a value added to the requirements needed to fill a job post. Remember that if you are in the world of software development, if you want to build, distribute and run code wherever, easily, solve your problems, experiment in new technologies, learn and understand the idea of the title in this article… You need to learn Docker.

Do you want to know more about what we offer and to see other success stories?
DISCOVER BLUETAB

SOLUTIONS, WE ARE EXPERTS

DATA STRATEGY
DATA FABRIC
AUGMENTED ANALYTICS

You may be interested in

MDM as a Competitive Advantage in Organizations

June 18, 2024
READ MORE

Cómo preparar la certificación AWS Data Analytics – Specialty

November 17, 2021
READ MORE

Myths and truths of software engineers

June 13, 2022
READ MORE

LakeHouse Streaming on AWS with Apache Flink and Hudi (Part 1)

April 11, 2023
READ MORE

Databricks on AWS – An Architectural Perspective (part 1)

March 5, 2024
READ MORE

Essential features to consider when adopting a cloud paradigm

September 12, 2022
READ MORE

Filed Under: Blog, tendencias

5 common errors in Redshift

December 15, 2020 by Bluetab

5 common errors in Redshift

Alvaro Santos

Senior Cloud Solution Architect​

Amazon Redshift can be considered to be one of the most important data warehouses currently and AWS offers it in its cloud. Working at Bluetab, we have had the pleasure of using it many times during our good/bad times as well as this year 2020. So we have created a list with the most common errors you will need to avoid and we hope this will be a great aid for you.

At Bluetab we have been working around data for over 10 years. In many of them, we have helped in the technological evolution of numerous companies by migrating from their traditional Data Warehouse analytics and BI environments to Big Data environments.

Additionally, at Cloud Practice we have been involved in cloud migrations and new developments of Big Data projects with Amazon Web Services and Google Cloud. All this experience has enabled us to create a group of highly qualified people who think/work in/for the cloud

To help you with your work in the cloud, we want to present the most common mistakes we have found when working with Redshift, the most important DW tool offered by AWS.

Here is the list:

  1. Working as if it were a PostgreSQL.
  2. Load data wrongly.
  3. Dimensioning the cluster poorly.
  4. Not making use of workload management (WLM).
  5. Neglecting maintenance.

What is Redshift?

Amazon Redshift is a very fast, cloud-based analytical (OLAP) database, fully managed by AWS. It simplifies and enhances data analysis using standard SQL compatible with most existing BI tools.

The most important features of Amazon Redshift are:

  • Data storage in columns: instead of storing data as a series of rows, Amazon Redshift organises the data by column. Because only the columns involved in queries are processed and the data in columns are stored sequentially on storage media, column-based systems require much less I/O, which greatly improves query performance.
  • Advanced compression: column-based databases can be compressed much more than row-based databases because similar data is stored sequentially on disk.
  • Massively Parallel Processing (MPP): Amazon Redshift automatically distributes the data and query load across all nodes.
  • Redshift Spectrum: lets you run queries against exabytes of data stored in Amazon S3.
  • Materialized views: subsequent queries that refer to the materialized views use the pre-calculated results to run much faster. Materialized views can be created based on one or more source tables using filters, projections, inner joins, aggregations, groupings, functions and other SQL constructs.
  • Scalability: Redshift has the ability to scale its processing and storage by increasing the cluster size to hundreds of nodes.

Amazon Redshift is not the same as other SQL database systems. Good practices are required to take advantage of all its benefits, so that the cluster will perform optimally.

1. Working as if it were a PostgreSQL

A very common mistake made when starting to use Redshift is to assume that it is simply a vitamin-enriched PostgreSQL and that you can start working with Redshift based on a schema compatible with that. However, you could not be more wrong.

Although it is true that Redshift was based on an older version of PostgreSQL 8.0.2, its architecture has changed radically and has been optimised over the years to improve performance for its strictly analytical use. So you need to:

  • Design the tables appropriately.
  • Launch queries optimised for MPP environments.


Design the tables appropriately

When designing the database, bear in mind that some key table design decisions have a considerable influence on overall query performance. Some good practices are:

  • Select the optimum data distribution type: 
    • For fact tables choose the DISTKEY type. This will distribute the data to the various nodes grouped by the chosen key values. This will enable you to perform JOIN type queries on that column very efficiently.
    • For dimension tables with a few million entries, choose the ALL type. It is advisable to copy those tables commonly used in joins of dictionary type to all the nodes. In that way the JOIN statement with much bigger fact tables will execute much faster.
    • When you are not clear on how you are going to query a very large table or it simply has no relation to the rest, choose the EVEN type. The data will be distributed randomly in this way.
  • It uses automatic compression, allowing Redshift to select the optimal type for each column. It accomplishes this by scanning a limited number of items.


Use queries optimised for MPP environments

As Redshift is a distributed MPP environment, query performance needs to be maximised by following some basic recommendations. Some good practices are:

  • The tables need to be designed considering the queries that will be made. Therefore, if a query does not match, you need to review the design of the participating tables.
  • Avoid using SELECT *. and include only the columns you need.
  • Do not use cross-joins unless absolutely necessary.
  • Whenever you can, use the WHERE statement to restrict the amount of data to be read.
  • Use sort keys in GROUP BY and SORT BY clauses so that the query planner can use more efficient aggregation.

2. Loading data in that way

Loading very large datasets can take a long time and consume a lot of cluster resources. Moreover, if this loading is performed inappropriately, it can also affect query performance.

This makes it advisable to follow these guidelines:

  • Always use the COPY command to load data in parallel from Amazon S3, Amazon EMR, Amazon DynamoDB or from different data sources on remote hosts.

 copy customer from 's3://mybucket/mydata' iam_role 'arn:aws:iam::12345678901:role/MyRedshiftRole'; 
  • If possible, launch a single command instead of several. You can use a manifest file or patterns to upload multiple files at once.

  • Split the load data files so that they are:

    • Of equal size, between 1 MB and 1 GB after compression.
    • A multiple of the number of slices in your cluster.
  • To update data and insert new data efficiently when loading it, use a staging table.

  -- Create an staging table and load it with the data to be updated
  create temp table stage (like target); 

  insert into stage 
  select * from source 
  where source.filter = 'filter_expression';

  -- Use an inner join with the  staging table to remove the rows of the target table to be updated

  begin transaction;

  delete from target 
  using stage 
  where target.primarykey = stage.primarykey; 

  -- Insert all rows from the of the staging table.
  insert into target 
  select * from stage;

  end transaction;

  -- Drop the staging table.
  drop table stage; 

3. Dimensioning the cluster poorly

Over the years we have seen many customers who had serious performance issues with Redshift due to design failures in their databases. Many of them had tried to resolve these issues by adding more resources to the cluster rather than trying to fix the root problem.

Due to this, I suggest you follow the flow below to dimension your cluster:

  • Collect information on the type of queries to be performed, data set size, expected concurrency, etc.

  • Design your tables based on the queries that will be made.

  • Select the type of Redshift instance (DC2, DS2 or RA3) depending on the type of queries (simple, long, complex…).

  • Taking the data set size into account, calculate the number of nodes in your cluster.

# of  Redshift nodes = (uncompressed data size) * 1.25 / (storage capacity of selected Redshift node type)  

« For storage size calculation, having a larger margin for performing maintenance tasks is also recommended »

  • Perform load tests to check performance.

  • If it does not work adequately, optimise the queries, even modifying the design of the tables if necessary.

  • Finally, if this is not sufficient, iterate until you find the appropriate node and size dimensioning.

4. Not making use of workload management (WLM)

It is quite likely that your use case will require multiple sessions or users running queries at the same time. In these cases, some queries can consume cluster resources for extended periods of time and affect the performance of the other queries. In this situation, simple queries may have to wait until longer queries are complete.

By using WLM, you will be able to manage the priority and capacity of the different types of executions by creating different execution queues.

You can configure the Amazon Redshift WLM to run in two different ways:

  • Automatic WLM: the most advisable manner is to enable Amazon Redshift so that it manages how resources are split to run concurrent queries with automatic WLM. The user manages queue priority and Amazon Redshift determines how many queries run simultaneously and how much memory is allocated to each query submitted.
  • Manual WLM: alternatively, you can configure resource use for different queues manually. At run time, queries can be sent to different queues with different user-managed concurrency and memory parameters.


How WLM works

When a user runs a query, WLM assigns the query to the first matching queue, based on the WLM queue assignment rules.

 
  • If a user is logged in as a superuser and runs a query in the query group labelled superuser, the query is assigned to the superuser queue.
  • If a user belongs to a listed user group or runs a query within a listed query group, the query is assigned to the first matching queue.
  • If a query does not meet any criterion, the query is assigned to the default queue, which is the last queue defined in the WLM configuration.

5. Neglecting maintenance.

Database maintenance is a term we use to describe a set of tasks executed with the intention of improving the database. There are routines to help performance, free up disk space, check data errors, check hardware faults, update internal statistics and many other obscure (but important) things.

In the case of Redshift, there is a mistaken feeling that as it is a service fully managed by Amazon, there is no need for any. So you create the cluster and forget about it. While AWS makes it easy for you to manage numerous tasks (create, stop, start, destroy or perform back-ups), this could not be further from the truth.

The most important maintenance tasks you need to perform in Redshift are:

  • System monitoring: the cluster needs monitoring 24/7 and you need to perform periodic checks to confirm that the system is functioning properly (no bad queries or blocking, free space, adequate response times, etc.). You also need to create alarms to be able to anticipate any future service downtimes.
  • Compacting the DB: Amazon Redshift does not perform all compaction tasks automatically in all situations and you will sometimes need to run them manually. This process is called VACUUM and it needs to be run manually to be able to use SORT KEYS of the INTERLEAVED type. This is quite a long and expensive process that will need to be performed, if possible, during maintenance windows.
  • Data integrity: as with any data loading, you need to check that the ETL processes have worked properly. Redshift has system tables such as STV_LOAD_STATE where you can find information on the current status of the COPY instructions in progress. You should check them often to confirm that there are no data integrity errors.
  • Detection of heavy queries: Redshift continuously monitors all queries that are taking longer than expected and that could be negatively impacting service performance. So that you can analyse and investigate those queries, you can find them in system tables as STL_ALERT_EVENT_LOG or through the AWS web console itself.
Do you want to know more about what we offer and to see other success stories?
DISCOVER BLUETAB
Álvaro Santos
Senior Cloud Solution Architect​

My name is Álvaro Santos and I have been working as Solution Architect for over 5 years. I am certified in AWS, GCP, Apache Spark and a few others. I joined Bluetab in October 2018, and since then I have been involved in cloud Banking and Energy projects and I am also involved as a Cloud Master Partitioner. I am passionate about new distributed patterns, Big Data, open-source software and anything else cool in the IT world.

SOLUTIONS, WE ARE EXPERTS

DATA STRATEGY
DATA FABRIC
AUGMENTED ANALYTICS

You may be interested in

Container vulnerability scanning with Trivy

March 22, 2024
READ MORE

¿Existe el Azar?

November 10, 2021
READ MORE

IBM to acquire Bluetab

July 9, 2021
READ MORE

Big Data and loT

February 10, 2021
READ MORE

Databricks on Azure – An Architecture Perspective (part 1)

February 15, 2022
READ MORE

De documentos en papel a datos digitales con Fastcapture y Generative AI

June 7, 2023
READ MORE

Filed Under: Blog, Practices, Tech

Hashicorp Boundary

December 3, 2020 by Bluetab

Hashicorp Series Boundary

Javier Pérez

DevOps Engineer

Javier Rodriguez

Cloud DevOps

Jorge de Diego

Cloud DevOps Engineer

After the last HashiConf Digital, the Cloud Practice wants to present you one of the main innovations that were presented: Boundary. In this post we are going to discuss what offers this new tool, why it is interesting, what we have found and how we have tested it.

What is Hashicorp Boundary?

Hashicorp Boundary is, as themselves claim, a tool that allows access any system using identity as a fundamental piece. What does this really mean?
Traditionally, when a user acquires the permission to access a remote service, he or she also gets explicit permission to the network where the service resides. However, Boundary, following the minimum privilege principle, provides us with an identity-based system for users who need access to applications or machines. For example, it is an easy way of access to a server via SSH using ephemeral keys as authentication method.

This means that Boundary limits what resources you can connect to and also manages the different permissions and accesses to resources with an authentication.

It is especially interesting because in the future it will be marked by the strong integration that it will have with other Hashicorp tools, especially Vault for credentials management and audit capabilities.

In case you are curious, Hashicorp has released the source code of Boundary which you have available at Github and the official documentation can be read on their website:
boundaryproject.

How have we tested Boundary?

BBased on an example project from Hashicorp, we have developed a small proof of concept that deploys Boundary in a hybrid-cloud scenario in AWS and GCP. Although the reference architecture does not said nothing about this design, we wanted to complete the picture and
set up a small multi-cloud stage to see how this new product.

The final architecture in broad terms is:

Once the infrastructure has been deployed and the application configured, we have tested connecting to the instances through SSH. All the source code is based on terraform 0.13 and you can find it in Bluetab-boundary-hybrid-architecture, where you will also find a detailed README that specifies the actions you have to follow to reproduce the environment, in particular:

  • Authentication with your user (previously configured) in Boundary. To accomplish this, you have to set the Boundary controllers endpoint and execute the following command: boundary authenticate.
  • Execute: boundary connect ssh with the required parameters to point to the selected target (this target represents one or more instances or endpoints)

In this particular scenario, the target is composed by two different machines:
one in AWS and one in GCP. If Boundary is not told which particular instance you want to access from that target, it will provide access to one of them randomly. Automatically, once you have selected the machine you want to access, Boundary will route the request to the appropriate worker, who has access to that machine.

What did we like?

  • The ease of configuration. Boundary knows exactly which worker has to address the request taking into account which service or machine is being requested.
    As the entire deployment (both infrastructure and application) has been done using terraform, the output of one deployment serves as the input of the other and everything is perfectly integrated.

  • It offers both graphic interface and CLI access. Despite being in a very early stage of development, the same binary includes (when configured as controller) a very clean graphical interface, in the same style as the rest of the Hashicorp tools. However, as not all functionality is currently implemented through the interface it is necessary to make configuration using the CLI.

What would we have liked to see?

  • Integration with Vault and indentity providers (IdPs) is still in the roadmap and until next versions it is not sure that it will be included.

  • The current management of the JWT token from the Boundary client to the control plane which involves installing a secret management tool.

What do we still need to test?

Considering the level of progress of the current product development, we would be missing for understanding and trying to:

  • Access management by modifying policies for different users.

  • Perform a deepest research on the components that manage resources (scopes, organizations, host sets, etc.)

Why do we think this product has great future?

Once the product has completed several phases in the roadmap that Hashicorp has established, it will greatly simplify resources access management through bastions in organizations. Access to instances can be managed simply by adding or modifying the permissions that a user has, without having to distribute ssh keys, perform manual operations on the machines, etc.

In summary, this product gives us a new way to manage access to different resources. Not only through SSH, but it will be a way to manage access through roles to machines, databases, portals, etc. minimizing the possible attack vector when permissions are given to contractors. In addition, it is presented as a free and open source tool, which will not only integrate very effectively if you have the Hashicorp ecosystem deployed, but will also work seamlessly without the rest of Hashicorp’s tools.

One More Thing…

We encountered a problem caused by the way in which the information about the network addresses of controllers and workers for subsequent communication was stored. After running our scenario with a workaround based on iptables we decided to open a issue on Github. In only one day, they solved the problem by updating their code. We downloaded the new version of the code, tested it and it worked perfectly. Point in favour for Hashicorp for the speed of response and the efficiency they demonstrated. In addition, recently it has been published a new release of Boundary, including this fix along with many other features Boundary v0.1.2.

¿Quieres saber más de lo que ofrecemos y ver otros casos de éxito?
DESCUBRE BLUETAB

SOLUCIONES, SOMOS EXPERTOS

DATA STRATEGY
DATA FABRIC
AUGMENTED ANALYTICS

Te puede interesar

Bluetab is certified under the AWS Well-Architected Partner Program

October 19, 2020
LEER MÁS

Databricks on Azure – An architecture perspective (part 2)

March 24, 2022
LEER MÁS

Mi experiencia en el mundo de Big Data – Parte II

February 4, 2022
LEER MÁS

Leadership changes at Bluetab EMEA

April 3, 2024
LEER MÁS

How much is your customer worth?

October 1, 2020
LEER MÁS

Snowflake, el Time Travel sin DeLorean para unos datos Fail-Safe.

February 23, 2023
LEER MÁS

Filed Under: Blog, Practices, Tech

Bluetab is certified under the AWS Well-Architected Partner Program

October 19, 2020 by Bluetab

Bluetab is certified under the AWS Well-Architected Partner Program

Bluetab

In our journey as benchmarks specialising in Data Solutions, /bluetab has earned certification under the AWS Well-Architected Partner Program. This enables us to partner our clients in designing and optimising workloads based on recommended AWS best practices. 
Our Professional Excellence DNA accredits us in establishing good architectural habits, minimising risk and responding speedily to changes that impact designs, applications and workloads.
If you are an AWS customer and need to create high-quality solutions or monitor your workload status, do not hesitate to contact us at inquiries@beta.bluetab.net.

What do we do with WAPP?

Establish technical, tactical and strategic measures to take advantage of the opportunities for improvement in each of the various areas

Cost optimisation
Identifying recurring replaceable actions or unnecessary parts to reduce costs

Security
Establishing data and system risks

Efficiency
Setting the resources necessary to avoid duplicities, overloads or any other inefficiencies

Excellence
Monitoring and controlling execution to make continual improvements and maintain the other pillars appropriately

Reliability
Visualising the errors that affect the client, correcting and recovering them quickly

Do you want to know more about what we offer and to see other success stories?
DISCOVER BLUETAB

SOLUTIONS, WE ARE EXPERTS

DATA STRATEGY
DATA FABRIC
AUGMENTED ANALYTICS

You may be interested in

Oscar Hernández, new CEO of Bluetab LATAM.

May 16, 2024
READ MORE

Using Large Language Models on Private Information

March 11, 2024
READ MORE

LakeHouse Streaming on AWS with Apache Flink and Hudi (Part 2)

October 4, 2023
READ MORE

Boost Your Business with GenAI and GCP: Simple and for Everyone

March 27, 2024
READ MORE

Some of the capabilities of Matillion ETL on Google Cloud

July 11, 2022
READ MORE

Workshop Ingeniería del caos sobre Kubernetes con Litmus

July 7, 2021
READ MORE

Filed Under: Blog, Noticias

Incentives and Business Development in Telecommunications

October 9, 2020 by Bluetab

Incentives and Business Development in Telecommunications

Bluetab

The telecommunications industry is changing faster than ever. The growing proliferation of competitors forces operators to consider new ways of being relevant to customers and businesses. Many companies have decided to become digital service providers, with the aim of meeting the needs of increasingly demanding consumers.

Telecommunications companies have endured a decade of continual challenges, with the industry subjected to a series of disruptions that push them to innovate to avoid being left behind. The smartphone revolution has led consumers to demand unlimited data and connectivity over other services.

Some studies show that the main challenges facing telecoms operators are growing, disruptive competition, agility, and investment, from which four key messages are drawn for understanding the future of the sector:

1. Disruptive competition tops the list of sector challenges

Platforms like WhatsApp-Facebook, Google and Amazon have redefined the customer experience by providing instant messaging services, which have had a direct impact on demand for services such SMS, drastically decreasing it.

Additionally, the market trend is to offer multi-service packages and to enable the customer to customise them according to their own needs, leading to mergers, acquisitions and partnerships between companies, in order to offer ever more diverse services.

2. Commitment to digital business models and innovation in the customer experience

The great opportunities offered by digitisation have made it the concept that the vast majority of companies in the sector aspire to. It is not surprising that in the telecommunications sector too, attempts are being made to move towards a digital business model.

According to the Vodafone Enterprise Observatory, 53% of companies understand digitisation as the use of new technologies in their business processes and 45% as the use of new technologies to improve customer service.

3. The post-2020 landscape will be transformed by 5G

The new generation of mobile telephony, 5G, that will revolutionise not only the world of communications but the industry of the future, has just reached Spain. The four domestic operators – Telefónica, Orange, Vodafone and MásMóvil – have already launched the first commercial 5G services, although only in major cities, with reduced coverage and greatly limited technical capabilities. This early start has also been influenced by the change that has occurred due to the COVID-19 pandemic, which has revealed the need for good quality connection at all times for smart working, digital education, on-line shopping and the explosion of streaming. Spain has Europe’s most powerful fibre network, but there are still regions without coverage. Thanks to full commitment to FTTH (fibre-to-the-home), Spain has a stable connection that runs from the telephone exchange to home directly. According to data from the Fibre to the Home Council Europe 2020, Spain has more fibre-connected facilities (10,261) than France, Germany, Italy and the United Kingdom put together.

The operators play a leading role with these needs for digitisation.

Measures to be taken into account

Achieving such long-awaited digitisation is not an easy process, and it requires a change in organisational mentality, structure and interaction.

While talent is believed to be a key element for digital transformation, and a lack of digital skills is perceived to be a barrier to that transformation, actions say otherwise. Because only 6% of managers consider growth and retention of talent to be a strategic priority.

Workers’ perspective on their level of work motivation:

  • 40% feel undervalued and unappreciated by their company. This increases the likelihood that employees will look for another job that will give them back their motivation to work.
  • 77% of workers acknowledge that they would get more involved in their work if their achievements were recognised within the organisation.
  • Over 60% of people state that an incentives or social benefits programme contributes to them not wanting to look for another job. This is something for companies to take into account, because it is estimated that retaining talent can generate increases in company profits of between 25% and 85%.

Companies’ perspective on their employees’ level of work motivation:

  • 56% of managers of people say they are “concerned” about their employees leaving the company.
  • 89% of companies believe that the main reason their workers look for another job is to go for higher wages. However, only 12% of employees who change company earn more in their new jobs, demonstrating that it is not economic remuneration alone that motivates the change.
  • 86% of companies already have incentives or recognition systems for their employees.

So, beyond the changes and trends set to occur in this sector, Telecommunications companies need to intensify their talent retention and make it a priority to address all the challenges they face on their journey to digitisation.

A very important measure for retaining and attracting talent is work incentives. Work incentives are compensations to the employee from the company for achieving certain objectives. This increases worker engagement, motivation, productivity and professional satisfaction.

As a result, companies in the sector are increasingly choosing to develop a work incentives programme, where they have previously studied and planned the appropriate and most suitable incentives, depending on the company and the type of employees, with the aim of motivating their workers to increase their production and improve their work results.

In the case of the communications sector, these measures will also increase company sales and profits. Within this sector, sales are made through distributors, agencies, internal sales and own stores, aimed both at individual customers and companies. That is why such importance is given to the sales force, leading to more highly motivated sales people with greater desire to give the best of themselves every day, so leading to improved company profits.

Furthermore, all the areas associated with sales, departments that enable, facilitate and ensure the healthiness of sales, as well as customer service, will be subject to incentives.

For an incentive system to be effective, it is essential for it to be well-defined, well-communicated, understandable and based on measurable, quantifiable, explicit and achievable objectives.

Work incentives may or may not be economic. For the employee, it needs to be something that recompenses or rewards them for their efforts. Only in that way will the incentives plan be effective.

Finally, once the incentives plan has been established, the company needs to assess it regularly, because in a changing environment such as the present, company objectives, employee motivations and the market will vary. To adapt to changes in the market and to the various internal and external circumstances, it will need to evolve over time.

What advantages do incentive systems offer telecoms companies?

Implementing an incentives plan in the company has numerous benefits for workers, but also for companies it:

  • Improves employee productivity
  • Attracts qualified professionals
  • Increases employee motivation
  • Assesses results
  • Encourages teamwork


In one of our telecoms clients, /bluetab
 has developed an internal business tool to calculate incentives for the various areas associated with sales. The work incentives are economic in this case, and performance assessment, associated with meeting their objectives, consists of an economic percentage of their salary. Achieving a series of objectives measures contribution to profitable company growth over a period of time.

The following factors are taken into account in developing the incentives calculation:

  • Policy: Definition and approval of the incentives policy for the various sales segments and channels by HR.
  • Objectives: Distribution of company objectives as spread across the various areas associated with sales.
  • Performance: Performance of the sales force and areas associated with sales over the periods defined previously in the policy.
  • Calculation: Calculation of performance and achievement of objectives, of all the profiles included in the incentive policy.
  • Payment: Addition of payment to the payroll for the corresponding performance-based incentives. Payments will be bimonthly, quarterly, semi-annual or annual.

How do we do it?

/bluetab develops tools for tracking the achievement of objectives and calculation of incentives. This allows everyone related to sales, to whom this model applies, to track their results, as well as the various departments related to their decision, human resources, sales managers, etc.

The most important thing in developing these types of tools is to analyse all the client’s needs, gather all the information necessary for calculating the incentives and fully understand the policy. We analyse and compile all the data sources needed for subsequent integration into a single repository.

The various data sources may be Excel, csv or txt files, the customer’s various information systems, such as Salesforce, offer configuration tools, database systems (Teradata, ORACLE, etc.). The important thing is to adapt to any environment in which the client works.

We typically use processes programmed in Python to extract from all the data sources automatically. We then integrate all the resulting files using ETL processes, performing all the necessary transformations and loading the transformed data into a database system as a single repository (e.g. Teradata).

Finally, we connect the database to a data visualisation tool, such as Power BI. All the incentives calculations are implemented in that tool. Scorecards are then published to share this with the various users, providing security both at access and data protection levels.

As an added value, we include forecasts in two different ways. The first is based on data provided by the customer, reported in turn by the sales force. The second by integrating predictive analysis algorithms using Python, Anaconda, Spider, R which, based on a historical record of the various KPIs, enables estimation of future data with low margins of error. This allows for prediction of the results of future incentives.

Additionally, simulations of the various scenarios can be carried out, using parameters, for calculation of the objectives and achievement of incentives.

The/bluetab tool developed will enable departments affected by incentives to perform daily, weekly, monthly or yearly monitoring of their results in a flexible, dynamic, agile manner. As well as allowing the departments involved in the decisions to monitor the data, it will also enable them to improve future decision making.

Benefits provided by /bluetab

  • Centralisation of information, the chance to perform calculation and monitoring using a single tool.
  • Higher updating frequency: going from monthly and semi-annual updating in some cases to daily, weekly and real-time on occasions.
  • Reduction of 63% in time spent on manual calculation tasks.
  • Greater traceability and transparency.
  • Scalability and depersonalisation of reporting.
  • Errors from manual handling of multiple different sources reduced by 11%. Data quality.
  • Artificial intelligence simulating different scenarios.
  • Dynamic visualisation and monitoring of information.
  • Improved decision-making at the business level.
Do you want to know more about what we offer and to see other success stories?
DISCOVER BLUETAB

SOLUTIONS, WE ARE EXPERTS

DATA STRATEGY
DATA FABRIC
AUGMENTED ANALYTICS

You may be interested in

Gobierno del Dato: Una mirada en la realidad y el futuro

May 18, 2022
READ MORE

Spying on your Kubernetes with Kubewatch

September 14, 2020
READ MORE

El futuro del Cloud y GenIA en el Next ’23

September 19, 2023
READ MORE

Bank Fraud detection with automatic learning II

September 17, 2020
READ MORE

Snowflake Advanced Storage Guide

October 3, 2022
READ MORE

Serverless Microservices

October 14, 2021
READ MORE

Filed Under: Blog, tendencias

Cómo depurar una Lambda de AWS en local

October 8, 2020 by Bluetab

Cómo depurar una Lambda de AWS en local

Bluetab

AWS Lambda es un servicio serverless mediante el que se puede ejecutar código sin necesidad de levantar ni administrar máquinas. Se paga solamente por el tiempo consumido en la ejecución (15 minutos como máximo).

El servicio dispone de un IDE simple, pero por su propia naturaleza no permite añadir puntos de ruptura para depurar el código. Seguro que algunos de vosotros os habéis visto en esta situación y habéis tenido que hacer uso de métodos poco ortodoxos como prints o ejecutar el código directamente en vuestra máquina, pero esto último no reproduce las condiciones reales de ejecución del servicio.

Para permitir depurar con fiabilidad desde nuestro propio PC, AWS pone a disposición SAM (Serverless Application Model).

Instalación

Los requisitos necesarios son (se ha usado Ubuntu 18.04 LTS):

  • Python (2.7 ó >= 3.6)
  • Docker
  • IDE que se pueda enlazar a un puerto de debug (en nuestro caso usamos VS Code)
  • awscli


Para instalar la CLI de AWS SAM desde AWS recomiendan brew tanto para Linux como macOS, pero en este caso se ha optado por hacerlo con pip por homogeneidad:

python3 -m pip install aws-sam-cli 

Configuración y ejecución

1. Iniciamos un proyecto SAM

sam init 
  • Por simplicidad se selecciona “AWS Quick Start Templates” para crear un proyecto a través de plantillas predefinidas
  • Se elige la opción 9 – python3.6 como el lenguaje del código que contendrá nuestra lambda
  • Se selecciona la plantilla de “Hello World Example»

En este momento ya tenemos nuestro proyecto creado en la ruta especificada:

  • /helloworld: app.py con el código Python a ejecutar y requirements.txt con sus dependencias
  • /events: events.json con ejemplo de evento a enviar a la lambda para su ejecución. En nuestro caso el trigger será un GET a la API a http://localhost:3000/hello
  • /tests : test unitario
  • template.yaml: plantilla con los recursos de AWS a desplegar en formato YAML de CloudFormation. En esta aplicación de ejemplo sería un API gateway + lamba y se emulará ese despliegue localmente

2. Se levanta la API en local y se hace un GET al endpoint

sam local start-api 

Concretamente el endpoint de nuestro HelloWorld
será http://localhost:3000/hello Hacemos un GET

Y obtenemos la respuesta de la API

3. Añadimos la librería ptvsd (Python Tools for Visual Studio) para debugging a requirements.txt quedando como:

requests
ptvsd 

4. Habilitamos el modo debug en el puerto 5890 haciendo uso del siguiente código en helloworld/app.py

import ptvsd

ptvsd.enable_attach(address=('0.0.0.0', 5890), redirect_output=True)
ptvsd.wait_for_attach() 

Añadimos también en app.py dentro de la función lambda_handler varios prints para usar en la depuración

print('punto de ruptura')

print('siguiente línea')

print('continúa la ejecución')

return {
    "statusCode": 200,
    "body": json.dumps({
        "message": "hello world",
        # "location": ip.text.replace("\n", "")
    }),
} 

5. Aplicamos los cambios realizados y construimos el contenedor

sam build --use-container 

6. Configuramos el debugger de nuestro IDE

En VSCode se utiliza el fichero launch.json. Creamos en la ruta principal de nuestro proyecto la carpeta .vscode y dentro el fichero

{
  "version": "0.2.0",
  "configurations": [
      {
          "name": "SAM CLI Python Hello World",
          "type": "python",
          "request": "attach",
          "port": 5890,
          "host": "127.0.0.1",
          "pathMappings": [
              {
                  "localRoot": "${workspaceFolder}/hello_world",
                  "remoteRoot": "/var/task"
              }
          ]
      }
  ]
} 

7. Establecemos un punto de ruptura en el código en nuestro IDE

8. Levantamos nuestra aplicación con la API en el puerto de debug

sam local start-api --debug-port 5890 

9. Hacemos de nuevo un GET a la URL del endpoint http://localhost:3000/hello

10. Lanzamos la aplicación desde VSCode en modo debug, seleccionando la configuración creada en launch.json

Y ya estamos en modo debug, pudiendo avanzar desde nuestro punto de ruptura

Alternativa: Se puede hacer uso de events/event.json para lanzar la lambda a través de un evento definido por nosotros

En este caso lo modificamos incluyendo un solo parámetro de entrada:

{
   "numero": "1"
} 
Y el código de nuestra función para hacer uso del evento:
print('punto de ruptura número: ' + event["numero"]) 
De esta manera, invocamos a través del evento en modo debug:
sam local invoke HelloWorldFunction -d 5890 -e events/event.json 
Podemos ir depurando paso a paso, viendo como en este caso se hace uso del evento creado:
¿Quieres saber más de lo que ofrecemos y ver otros casos de éxito?
DESCUBRE BLUETAB

SOLUCIONES, SOMOS EXPERTOS

DATA STRATEGY
DATA FABRIC
AUGMENTED ANALYTICS

Te puede interesar

CLOUD SERVICE DELIVERY MODELS

June 27, 2022
LEER MÁS

Starburst: Construyendo un futuro basado en datos.

May 25, 2023
LEER MÁS

Cómo depurar una Lambda de AWS en local

October 8, 2020
LEER MÁS

Basic AWS Glue concepts

July 22, 2020
LEER MÁS

Desplegando una plataforma CI/CD escalable con Jenkins y Kubernetes

September 22, 2021
LEER MÁS

$ docker run 2021

February 2, 2021
LEER MÁS

Filed Under: Blog, Tech

  • « Go to Previous Page
  • Page 1
  • Interim pages omitted …
  • Page 5
  • Page 6
  • Page 7
  • Page 8
  • Page 9
  • Go to Next Page »

Footer

LegalPrivacy Cookies policy

Patron

Sponsor

© 2025 Bluetab Solutions Group, SL. All rights reserved.